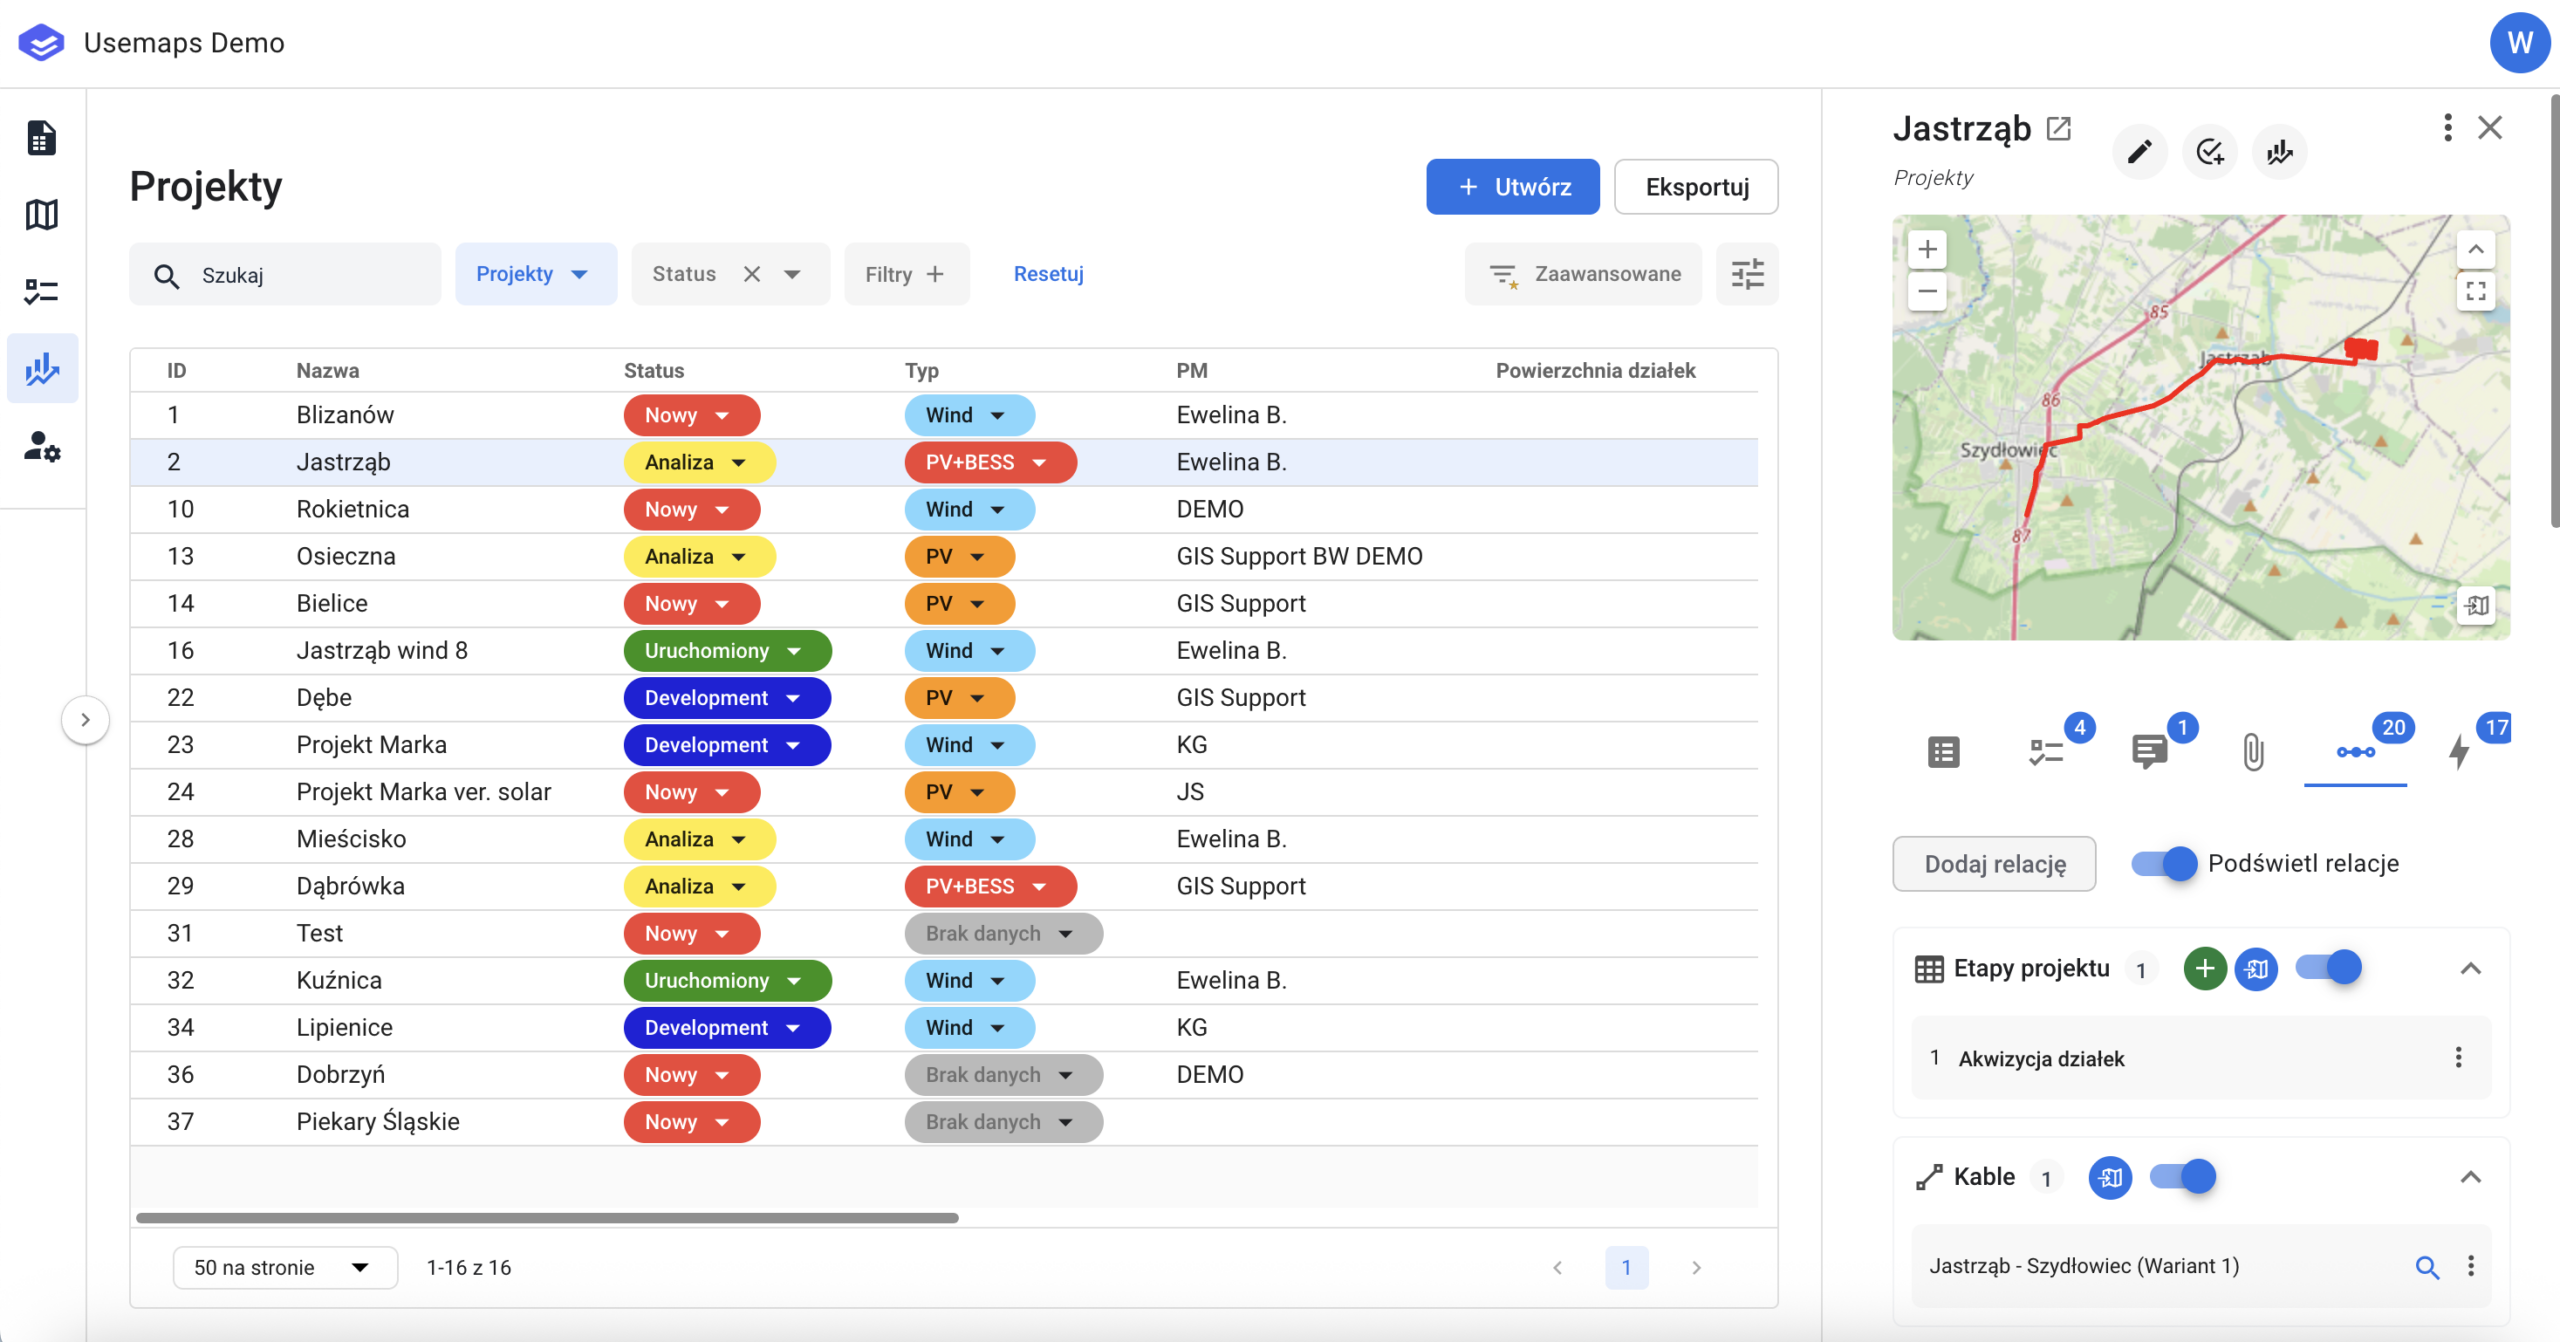
A system panel that displays all projects the user has access to. This panel is optional and requires additional configuration
Usemaps provides tools that enable effective project management:
- Tasks
- Schedules (Gantt charts)
- Dashboards
- Reports
- Statuses
Thanks to these, all people involved in the project have access to up-to-date information about the current project status and the work that is currently being carried out. The key element of project management is the Projects List Panel. This is a list that can be freely filtered and sorted.
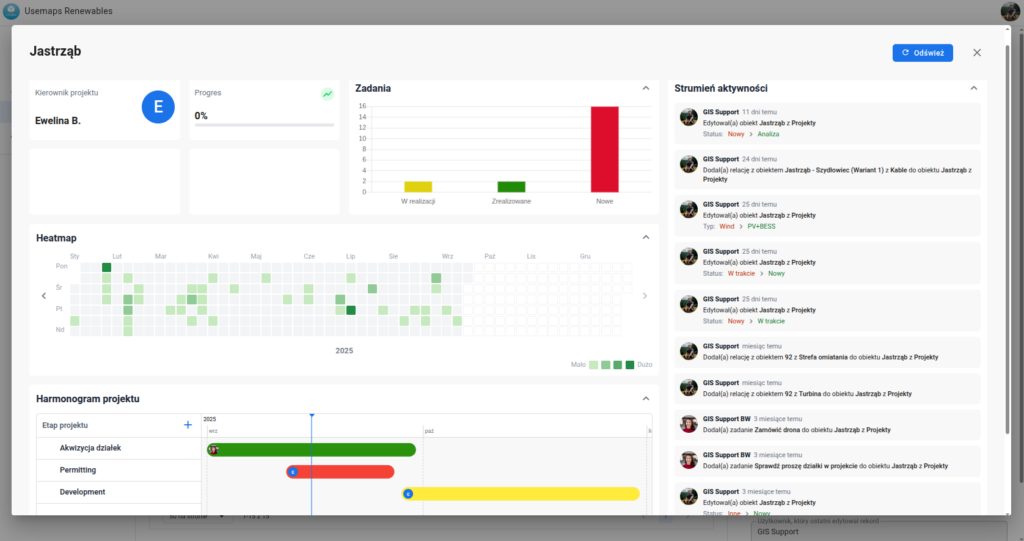
Each project has its own Dashboard.
The Project Dashboard is a place where data about a selected project is summarized:
- The activity stream, meaning notifications about user activities (edits, adding attachments, comments) related to all objects linked to the Project through a Relationship.
- Task summary, which is a consolidated overview of the status of tasks in the Project
- a so-called Calendar Heatmap, showing the distribution of recorded activities over time.
- Project schedule, meaning a classic, editable Gantt chart, which is a core element in project management.
The Project Dashboard can be opened by clicking a button in the Project Panel
Project schedule management is presented in the video below